Business Sales Dashboard
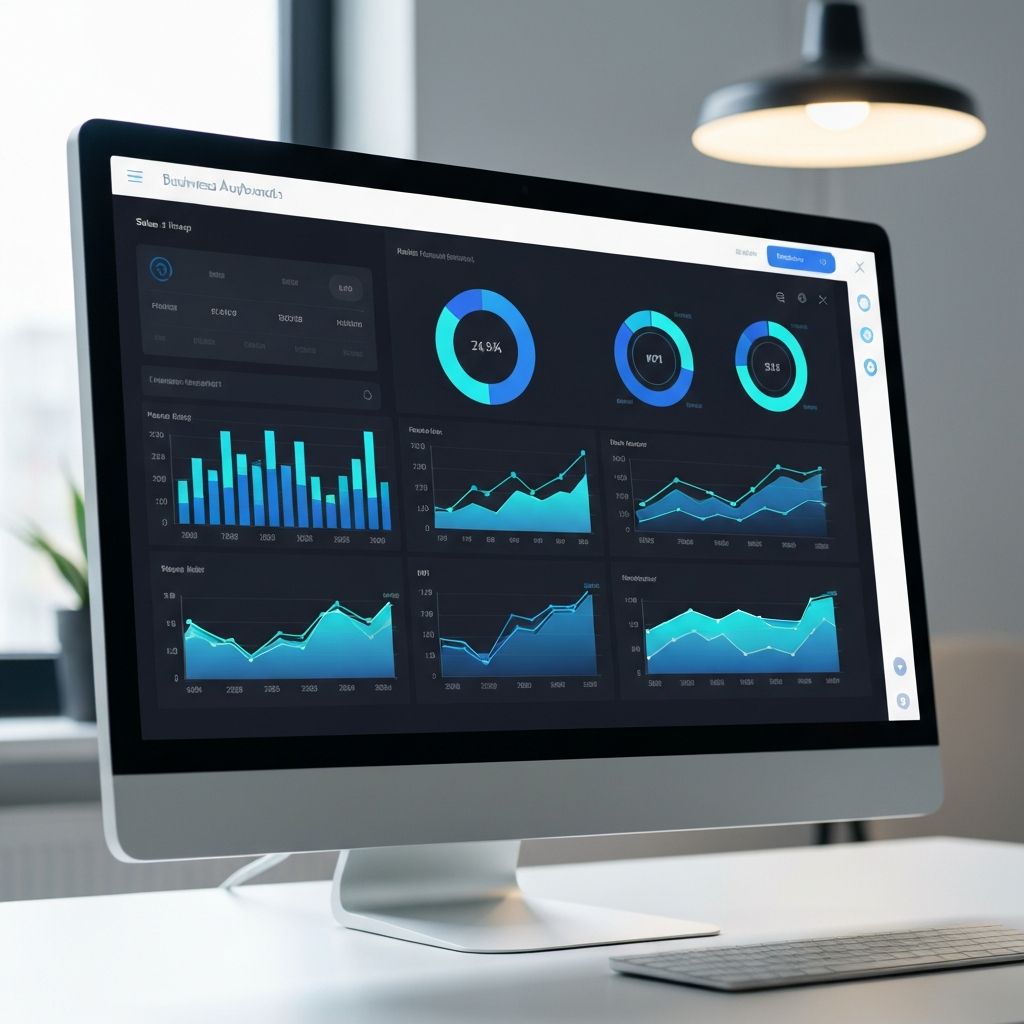
Interactive Power BI dashboard for a retail company to track sales performance across multiple locations.
Overview
A comprehensive sales analytics solution that transformed how a retail company tracks and understands their business performance across multiple store locations.
The Problem
A retail company was struggling to track sales performance across multiple locations and couldn't identify which products were driving revenue. Decision-makers lacked real-time visibility into their operations.
The Solution
Built an interactive Power BI dashboard that consolidated sales data from all locations, visualized trends, and highlighted top-performing products. The dashboard features drill-down capabilities and automated data refresh.
Process
Conducted stakeholder interviews to understand key metrics
Analyzed existing data sources and quality
Designed dashboard wireframes and got approval
Built data models and DAX calculations
Created interactive visualizations
Implemented automated data refresh
Trained team on dashboard usage
Results
35% improvement in inventory decisions and real-time visibility into sales performance across all branches.